Debugging is a crucial skill in software development—an art, really—that separates a good developer from a great one. No matter how meticulous you are, bugs are inevitable in any codebase. However, the speed and efficiency with which you find and fix them can make a world of difference in delivering reliable, high-quality software. This blog dives into essential debugging tools and techniques that can help you master the art of debugging and squash those pesky bugs faster than ever.
Understanding the Debugging Process
Before diving into tools and techniques, it’s important to understand the mindset behind effective debugging. Debugging is not just about fixing the error you see on the surface, it’s about getting to the root cause. Think of it like detective work: You must follow clues (error messages, logs, unexpected behavior) to find the underlying issue, and then figure out the best way to resolve it.
The debugging process typically follows these steps:
- Identify the Bug – Recognize something is wrong, whether through error messages, test failures, or unexpected behaviour.
- Reproduce the Bug – Find a reliable way to reproduce the issue consistently.
- Analyze the Bug – Investigate the code and figure out why the bug is occurring.
- Fix the Bug – Make the necessary code changes to resolve the issue.
- Test the Fix – Ensure that the bug is fixed and hasn’t introduced new issues.
Now, let’s move on to the tools and techniques that can make this process more efficient.
Key Debugging Tools
1. Integrated Development Environments (IDEs)
Modern IDEs like Visual Studio, PyCharm, Eclipse, and IntelliJ IDEA come with powerful debugging features that allow you to step through your code, inspect variables, and monitor the state of your application.
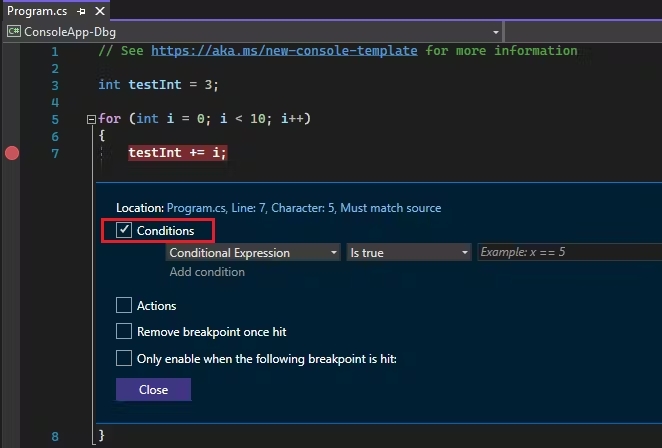
- Breakpoints: A crucial feature in most IDEs, breakpoints let you pause code execution at specific lines, allowing you to inspect the state of the program at that moment.
- Step Over, Step Into, Step Out: These options give you control over code execution, enabling you to investigate how the code flows and where things go wrong.

2. Command-Line Debuggers
For those working outside an IDE, command-line debugging tools can be highly effective. GDB (GNU Debugger) is a popular tool for C/C++ developers, while PDB (Python Debugger) is excellent for Python developers.
- These tools allow you to inspect variables, step through code, and even evaluate expressions directly from the command line. Command-line debuggers are especially useful when working on servers or in environments where an IDE isn’t available.
3. Logging Tools
While interactive debuggers are great, logging is another essential debugging tool that helps you trace code execution in production or complex applications. Libraries like Log4j (for Java), Winston (for Node.js), and Python’s logging module let you capture key data points in your application, making it easier to identify where things go wrong.
- Pro tip: Always ensure logs include contextual information like timestamps, error messages, and variable states to get a clearer picture of what’s happening.
4. Profilers
Sometimes, bugs aren’t functional but performance-related. Profilers help you measure the performance of your application, identifying memory leaks, inefficient algorithms, and other bottlenecks. Tools like Py-Spy (Python), YourKit(Java), and Valgrind (C/C++) are excellent for detecting and resolving performance issues.
Effective Debugging Techniques
1. Binary Search for Bugs
If you’re dealing with a large codebase, narrowing down the location of a bug can be tricky. One useful technique is the binary search method. By using breakpoints or print statements, you can repeatedly split your code in half and check whether the bug occurs in one half or the other, allowing you to isolate the faulty code more quickly.
- Tip: Start by isolating which part of the program (frontend, backend, database, etc.) the bug is in, then narrow it down further using this technique.
2. Rubber Duck Debugging
Believe it or not, sometimes just talking through your code helps you find bugs. This technique, known as rubber duck debugging, involves explaining your code line-by-line to an inanimate object (or a colleague). In many cases, just articulating your logic out loud can reveal the bug.
A developer using the rubber duck debugging method. Watch above.
3. Unit Tests and Test-Driven Development (TDD)
Unit tests are an invaluable debugging tool. By writing tests for small, isolated units of your code, you can quickly detect if a recent change has broken existing functionality. Test-Driven Development (TDD) takes this one step further by encouraging you to write tests before you write the code. This forces you to think about edge cases and potential bugs upfront.
JUnit(Java),pytest(Python), andJest(JavaScript) are examples of popular testing frameworks that make writing and running tests easy.
4. Divide and Conquer
When dealing with a large block of code that is failing, try breaking it down into smaller sections. Debugging smaller, isolated pieces of code makes it easier to track down the specific area where the bug is hiding. Once the buggy section is found, you can inspect it more thoroughly.
5. Backtracing
When you encounter a runtime error, it often comes with a stack trace that shows the sequence of function calls leading to the error. Analyzing this trace allows you to backtrack and identify which part of your code caused the error.
- Tip: Always look at the first error in the stack trace. The subsequent errors are often just consequences of the original issue.
Common Bug Types and How to Tackle Them
1. Null Pointer Exceptions
One of the most common bugs in programming, a null pointer exception occurs when your code tries to access an object or variable that hasn’t been initialized. Always check for nulls or undefined values before attempting to use objects or variables.
2. Off-by-One Errors
These errors often occur in loops, where the loop runs one time too many (or too few). Double-check your loop conditions to ensure that they are correct, especially when dealing with zero-based indexing.
3. Race Conditions
When dealing with multi-threaded programs, a race condition occurs when two or more threads try to access shared data simultaneously. Use locks, semaphores, or other synchronization mechanisms to ensure data consistency.
Conclusion
Debugging is a skill that takes time and practice to master, but having the right tools and techniques at your disposal can make a huge difference in your efficiency. From using the built-in capabilities of modern IDEs to mastering the art of logging and testing, there are countless ways to speed up the debugging process.
Remember, no matter how frustrating a bug may seem, approaching it methodically, using the right tools, and keeping a clear head can help you tackle even the most elusive issues. Debugging is not just about fixing code—it’s about improving the way we think and approach problems as developers.


