What does a data analyst do? Ask ten people and you will hear “Excel”, “dashboards” or “numbers”. All of that is true, but it is also incomplete.
A data analyst helps an organisation answer a business question with evidence: Why are customers leaving one branch and not another? Why did stock run out in Eldoret while it piled up in Mombasa? Which campaign actually brought in new sign-ups? In other words, the spreadsheet and the dashboard are simply where the answer ends up.
In this article we look at what a data analyst does day to day, what the role looks like across different industries, and why professionals who will never carry the title “analyst” are building the same skills. Two Moringa School alumni share how that shift played out in their own work, and we look at what the World Economic Forum and LinkedIn say about where work is heading.
What does a data analyst do? The short answer
A data analyst collects, cleans and studies data to answer specific business questions, then presents the findings so that people can make better decisions. In practice, that means working with tools like Excel, SQL and Power BI, spotting patterns and trends, and explaining what the numbers mean in plain language.
The tools matter, of course. However, the real value sits in two places most job descriptions underplay: asking the right question before touching the data, and telling the story clearly enough that a manager can act on it.
What the work actually looks like, step by step
To make it concrete, picture a retail chain with 12 branches across Kenya. Sales dipped last quarter and the regional manager wants to know why before the next stock order goes out. So, here is how an analyst would approach it.
The six steps behind every analysis
- Start with the question, not the spreadsheet. “Sales are down” is not a question. “Which branches and which product lines fell, and when did it start?” is. That is why good analysts spend real time here, because a vague question produces a pretty dashboard that answers nothing.
- Gather the data. Sales records from the point-of-sale system, stock reports, maybe M-Pesa payment exports and a promotions calendar. In most cases, it does not live in one place.
- Clean it. The same branch is spelt three ways. Some dates are missing. One month was entered twice. This is unglamorous work, and it is often the biggest share of the job, because insights built on messy data lead to wrong decisions.
- Analyse. Compare branches, look at trends week by week, and separate the signal from the noise. Maybe the drop sits in two branches only, and it started the week a competitor opened nearby. Alternatively, a popular product was out of stock for three weeks.
- Visualise and explain. Build a simple Power BI dashboard or Excel chart, then write three sentences a busy manager can act on. What happened, why it likely happened, what to do next.
- Keep it running. Turn the one-off analysis into a report that refreshes on its own, so next quarter the manager sees the problem early instead of after the fact.
The part most people never see
Notice that only steps 4 and 5 look like what most people imagine when they hear “data analyst”. In fact, the rest is thinking, checking and communicating. That is the part that separates someone who can use Excel from someone a business trusts with a decision.
What a data analyst does in different industries
The method stays the same. However, the questions change with the industry. Here is what analyst work tends to look like across sectors that hire in Kenya and the wider region.
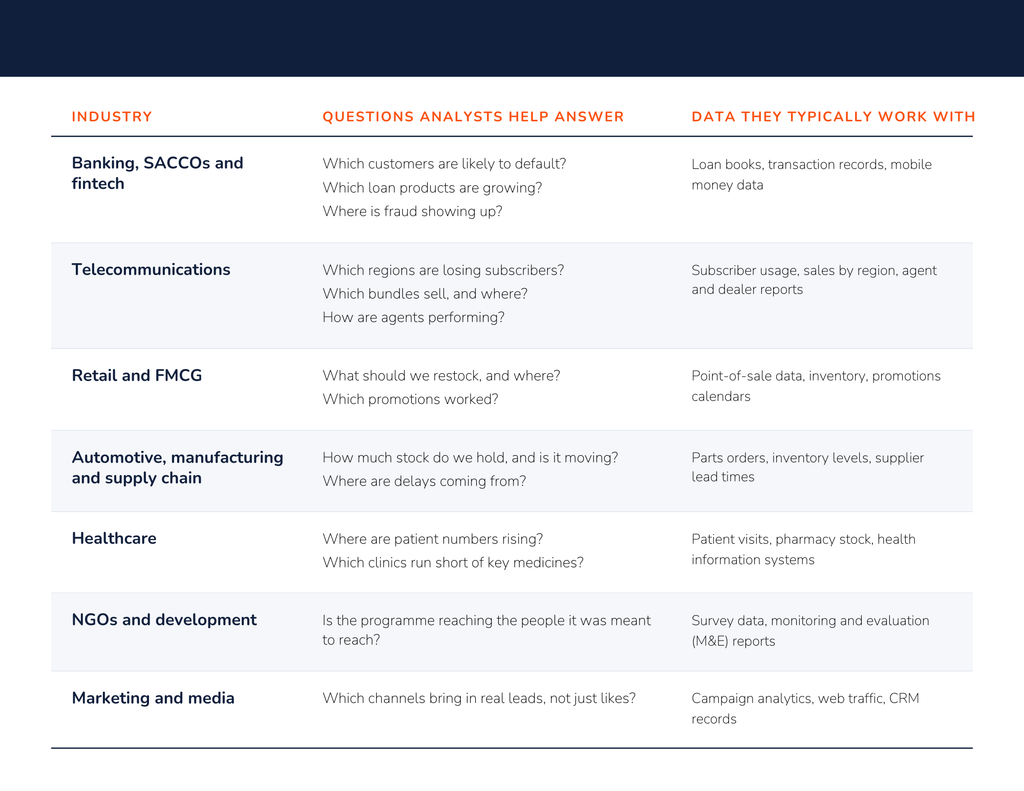
The job title also changes. The same skills show up under names like business analyst, BI analyst, MIS officer, M&E officer, revenue analyst, commercial analyst and insights analyst. If a role asks you to turn records into recommendations, it is analyst work, whatever the title says.
You do not need the title to need the skills
Here is the part that often gets missed. Some of the people doing the most useful analysis in an organisation are not analysts at all. Instead, they are regional managers, procurement officers, HR leads and programme coordinators who make decisions off reports every week. The difference between reading a report and understanding where it came from is now a real career advantage.
Two Moringa alumni show what that looks like in practice.
Tabitha Kavisu: from producing reports to understanding the business behind them
Tabitha’s path into data was not a straight line. She started with an internship at the Ministry of Agriculture, moved into sales at Airtel Kenya, then joined Simba Corporation as a Graduate Management Trainee, rotating through different departments. Later, as a Parts Ordering Analyst, she used spreadsheets every day to track stock levels, read demand and decide what to replenish.
She was already working with data. What she wanted was to go beyond the numbers she used for operational decisions and turn them into insights that supported bigger business decisions. So she joined Moringa’s Data Analytics with Excel and Power BI programme.
The biggest shift, in her words, was this: “One of the biggest changes was learning to think about the problem before thinking about the report.” Later, preparing for Microsoft’s PL-300 Power BI certification pushed her further, into how data models and relationships really work. As a result, she concluded that good analytics “isn’t just about knowing which buttons to press.”
Today Tabitha is a Data Analyst at Simba Corporation. She builds Power BI dashboards, tracks KPIs and analyses customer and sales data for teams across commercial, marketing, HR, supply chain and finance. Read how Tabitha went from spreadsheets to a data analyst career
Valerie: adding analytical depth to public health research
Valerie works in public health research, where data was already central to her job. In fact, she did not need convincing that data mattered. What she wanted was stronger technical skills, so she could do more than run the numbers: ask better questions, find insights that actually mean something, and share findings in a way that leads to action.
Studying Data Analytics at Moringa helped her build on the industry experience she already had, and made her more confident in her analysis and problem-solving. One lesson she carries forward: as AI and technology keep changing how we work, professionals need to stay curious, adaptable and committed to learning.
Today Valerie is growing where data analytics meets public health, using data to understand problems more clearly and contribute to solutions for the communities she serves.
Watch her full story on YouTube: https://youtu.be/47xOaGhoAIg
Two people, two industries, one pattern. Each already had the experience and the context. Data skills gave them a clearer way to use it.
What the industry is telling us
Moreover, these stories are not isolated. Two of the most closely watched sources on work and skills point the same way.
World Economic Forum: analytical thinking leads the list
The Future of Jobs Report 2025 surveyed more than 1,000 employers representing over 14 million workers across 55 economies. Analytical thinking came out as the most sought-after core skill, with seven out of 10 companies calling it essential. AI and big data topped the list of fastest-growing skills, and Big Data Specialists are among the fastest-growing jobs.
In addition, one detail in the same report says a lot. Data Entry Clerks are among the fastest-declining roles. In other words, typing data in is losing value, while understanding what the data means is gaining it. The WEF also expects 39% of workers’ existing skills to be transformed or become outdated by 2030, and 63% of employers see skills gaps as the biggest barrier to transforming their business.
LinkedIn: data skills are spreading to every function
LinkedIn’s Skills on the Rise 2026 report, based on member profile and hiring data, names data and analytics as one of five skill clusters growing across industries. It notes that data-led decision-making is showing up more often in sales, consulting, HR and marketing roles, and that data storytelling is gaining ground in business functions (summary via afaqs!). It also reports that 46% of recruiters globally now use skills data when filling roles.
If employers want people who can turn data into decisions, training has to look like the work itself. For that reason, the same idea shapes how Moringa School builds its Data Analytics with Excel and Power BI course, designed for working professionals and graduates who already deal with data and want to do more with it.
Your place in a data-driven world
Whether you want to become a data analyst, or you simply want to understand the reports you already rely on, the starting point is the same. Your experience got you here. Data skills help you use it better.
The data-driven workplace is not on its way. In fact, it is already here, in the reports on your desk and the decisions your team makes every week. As a professional, you do not need to change careers to be part of it. You need to be the person in the room who can look at the numbers, ask the right questions and explain what they mean.
If that is the kind of professional you want to become, take a look at what the Data Analytics with Excel and Power BI course and position yourself to lead with data in your field.